Friday 1 October 2021

Infrastructure as Code (IaC)

Is the process where Developers and DevOps team auto-magically manages and provision tech stack for an application using a software rather than doing it manual configuration of Hardware or OS using declarative definition file. 

With IaC we can build stable environment much Faster and Scale it, we can also enforce the consistency via code. 

There is no single standard syntax for declarative IaC, different platform supports different and often multiple ,file formats as well such as YAML, JSON and XML.

IaC is supported by list of popular third party tools such as Terraform, Ansible, Puppet. In this post we will use Terraform and cloud provider will be AWS. Terraform is supported by all major cloud provider i,e GCP, Azure.

First we need to install Terraform , I am using Mac so I can use brew to install Terraform if you are on Windows or Linux you can download it from here 


Now, you might be working for different client who uses different version of terraform for that there is a quick switchTo program which you can install and its really helpful in such cases.                          

 brew install warrensbox/tap/tfswitch


Now let's use code and create Infrastructure but before that I need to configure the aws-cli and secure the key, you can put them in the env. variables or in Vault providers as well, first I would like to create a VPC, its very simple just couple of lines of code and we will see who easy it is.

provider "aws" {
region = "eu-west-1"
}

resource "aws_vpc" "myvpc" {
cidr_block = "10.0.0.0/16"
}


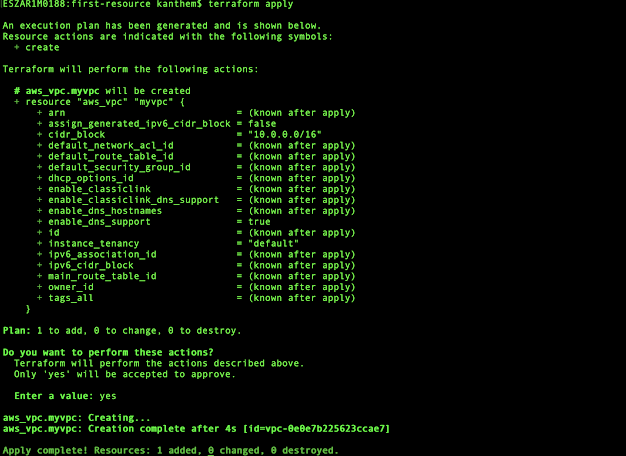
In the above code snippet, I have aws as provider and resource which I want to create is aws_vpc with cidr_block given To run this we need to execute two commands "terraform init" and "terraform apply".


Let's check the AWS console and see if we have this VPC ID 


Next , let's take an another example and create a free-tier EC2 instance with web security enabled for both ingress(Inbound) & egress(outbound). 


and we have our t2.micro EC2 instance is ready, with Security Groups for both inbound and outbound  


We saw couple of examples of IaC, how it can help us in managing and provision infrastructure using simple code and provides consistency. We can do everything that is required to manage Infrastructure.

IMPORTANT NOTE :- Use "terraform destroy" command to delete the resource.

Happy coding and keep sharing!! 


Wednesday 29 September 2021

Event Driven Architecture using Apache Kafka

A quick recap of what we discussed in the previous post about the EDA, and In this post, we will see more insight. EDA It is a pattern that uses events to communicate between decoupled components or services, and these events will need to be published to an event broker platform and then sent to the consuming applications.  

Event-Driven Architecture is comprised of three components.

  • Producers:- are the apps or services that publish the events to an event broker platform.
  • Router:- Routes them to their respective consuming applications 
  • Consumers:- Another app or service that consumes a particular topic in an event router.
When Designing the Event-Driven Models we can implement two Models.

  • Pub/Sub (Publish/Subscribe):- Events are published to a topic and sent to one or more subscribers, once received, the event cannot be backtracked or reread again, and new subscribers do not see the event.
  • Event Streaming:- Events are written to a log and ordered in a partition. A client app can read from any part of the stream and reply to the events.

We are going to use Apache Kafka, to implement the event-driven architecture, which is an open-source, distributed, event streaming platform. 

Using Apache Kafka we could have multiple apps or services that write event events to Kafka cluster and at the same time, we could also have multiple consumers apps that subscribe or stream events from Kafka, Where a Kafka Cluster is a collection of brokers and they could be actual physical servers or single rack and If you are using Kafka on the cloud or as (PaaS) then you don't have to concerned about it. 

Here, Zookeeper is the one who is responsible for the cluster & Failure management and decides which among the replicated brokers can be the new leader.   

The broker can store multiple topics where producers write events, where a topic is a collection of related events or messages. When producers produce an event we need to specify the topic where we want to write or publish it.


In the next post, we will build Spring Boot API, which will produce events and we will see end to end flow of producers, routers and consumers using that, until then.

Happy coding and keep sharing!!
 

Monday 27 September 2021

An Overview :- What is Event-Driven Architecture ?

Before, We jump into the EDA, let's understand the standard guidelines for system design or generally reactive manifesto. Which is something is community driven guidelines that are indented to give cohesive approach to system.     

So, the core of the reactive manifesto is make system message driven, more specifically "async" messaging.  


We want to make the system async messaging driven with scalabilityresilient and this helps us to build distributed systems or K8s. Where Scalable means our hardware should expand as the workload expands and By resilient we don't want any single point of failure and if it does we should be able to handle it elegantly.

Based on the above three foundations, we should be able to build a system that is responsive.   

Now, we have our core setup let's understand What is an event ?. In simple words, an event is a statement of facts that happened in the past. Let's talk about an example of a Retail application.


So, In an application, we have a checkout service and that service wants to talks to other services such as "Inventory", "Shipping", "Contact".

In the messaging model, if the inventory wants to know what the checkout is doing, the checkout will send a message directly to inventory to let it know a checkout happens. and to others as well directly to Shipping and to Contact service OR these services can message directly to checkout as well "Conversational Messaging", till now the message is sitting on a host machine.

When we design the event application our event producer might web app, mobile app, etc.. this will enable the events logs being produced by all the producing applications. 

Event logs can be used to Trigger an action In the case of IoT when any device turns on, It spins a pod on the Infra and that pod is a function as a Service (FaaS) that sits on top of Serverless Infrastructure and turns down when our function finishes by sending the event.  

With event logs we can optimize and custom data persistence, so can be possible that our Inventory service will consume data from stream send by web application m it will modify the local data and produce in the event backbone and this new stream is giving the most correct inventory data to any other application in the system.

Important things which happen here is we can save all our data raw or transformed in a Data Lake, this will help heavy application like AI.

Another thing that EDA enables is stream processing which is built on top of the Apache Kafka streams API.  

Benefits of Event/Driven Architecture
  • Asynchronous
  • Scalable and Failure Independent
  • Auditing and Point-in-time recovery 

Till now we have seen an overview and benefits of EDA that sit on top of reactive manifesto ideas for system designing.

In the next post, we will learn more about this in detail with some demo examples, Until then 

Happy coding and keep sharing!!  


Wednesday 4 December 2019

Using AWS Services to Monitor Tridion

When you have a very important and bulk publishing is going on and you want to monitor each state then AWS service is a great way of doing it. Recently, I had this opportunity to implement AWS services to monitor SDL Tridion publishing and Broker Database spike.  We need to monitor the publishing state and Broker DB connections limit and for that I used the following AWS services.

All these activity is required and becomes almost mandatory when yon have Huge INFRA to manage.
  1. AWS CloudWatch
  2. AWS SNS (Simple Notification Service)
  3. AWS lambda Function

To monitor the publishing I used the AWS Lambda function which is in python and some inline SQL script. Yes, just few lines of code gives you all the info.


This matrix is then used in the dashboard to generate the realtime GRAPH and Similarly, we have script for other publishing state which helps us in monitoring the progress of publishing. These scripts are very helpful when you have thousands of the items in queue and waiting for publishing.

Failed items

Published items

Next, is we need to implement the notification service to send the notification whenever the Broker Database DBconnectin limit reaches the higher side or more than expected so that we can take action pro-actively. To Implement this we used the AWS default Matrix and with the help of AWS SNS we are sending the notification, for notification you can use (EMAIL,SMS,HTTP,Notification etc) depending upon your requirement.


 You need to go to the CloudWatch--> Alarm and create a New Alarm. By Default in SQL Server the default DB connection is set to 0 which mean Unlimited, but using AWS CloudWatch you can monitor and can take pro.active steps when its starts increasing.   

Next is send the notification if the limit is crossed and for that we can use AWS SNS.
Configure SNS to send Notification. 

Where SNS is your notification service. We first need to create a Topics and based on Publisher and Subscriber model we can send the notification. Protocol supported by the AWS SNS to subscribe.

Protocol Available 

Or, you can configure the Auto Scaling of you EC2 instance, we only have notifications service configured but yes, we also have this options as well. It all depends on your requirements.

Auto Scaling option in case of Alarm 

We just saw how we can monitor SDL Tridion using AWS Service and takes pro-active steps. Configuring the AWS Service is pretty easy.


Happy Coding and Keep Sharing!!! 


Thursday 29 August 2019

SDL Tridion Sites 9.1 New Feature Integration Framework

Today SDL released the latest version SDL Tridion Sites 9.1 and in this release we have so many new features, but today we are going to discuss the SDL Tridion Integration Framework. These features enable you to quickly connect with your DAM, CRM, ERP, Marketing Automation, Commerce, PIM, Portal technology, Analytics, and Social Media platforms.

In this blog we will see how Unified Extensions/Connectors build using this framework will simplify the process of deploying multiple extensions in SDL Tridion Sites it combines multiple extensions that should be deployed together as a single solution. We can pack all together Content Manager, Content Manager Explorer, Dynamic Content Delivery and External Content Library extensions.

With EMS the problems that it solves is, we don't have to do configuration on multiple places, no need to restart services and IIS, one single package for multiple extensions and one of the biggest advantage is it supports scaled out environments - so if you have 3 x CM, 5 x publishers, etc. it's a one drop shop.


The package that is built contains.
  • Single zipped file
  • Manifest.json in the root of the zip
  • All reference to jars, dlls and other resources in the manifest.json file will be relative to the root of the zip
  • Dependent jars and dlls should be in the same folder as the source jar or dll
SDL released number of ready made connectors for us, we can download it from  https://appstore.sdl.com/

  1. Adding existing connector [Read More] If the Connector you are adding is written in C# (.NET Core), ensure that version 2.2 of the .NET Core Runtime is installed on the host machine the Content Service. Download the .NET Core Runtime for either Windows or Linux from the following location: https://dotnet.microsoft.com/download/dotnet-core/2.2
  2. Build a new connector [Read More]


In the next blog, we will be creating Extensions until then. 

Happy Coding and keep Sharing!!!
  

Sunday 28 July 2019

Manage SDL Microservice using Jenkins

As a developer, if have the access to servers, to monitor, start/stop, reading logs of SDL Microservice your life is very easy, but when we work in a cage environment and you don't have access to servers due to policies or your client has to follow certain standards such as "PCI" and stuff like that as a DEV you don't get the direct access on those machines.

Using Powershell, Yes we can do that, but what will happen when you don't have the permission to run Powershell as well and I worked on a project where, as a developer, I didn’t have the permission to run Powershell as well.

Well, In that case, we ask the DevOps to do this job for us because they are the one having all the access, but this could be a time-consuming process as well, log a ticket and then someone from DevOps address that and as a developer, we might be required to start/stop and see logs of Microservice multiple times.

There is another scenario where you have your content delivery on the Linux box, not all your developers are very familiar with the Linux commands. 

As a best practice, we should always use proper tools in such a scenario, and today we will see how we can configure Jenkins to start/stop/restart SDL Microservices.

Installing Jenkins is really quick and it takes very less time to configure it.

1. Download Jenkins.
2. Open up a terminal in the download directory.
3. Run java -jar jenkins.war --httpPort=8080. Refer screenshot 1
4. Browse to http://localhost:8080.
5. Follow the instructions to complete the installation.

Run the Jenkins.war
Jenkins is installed successfully and We have the initial password to login 

Next is let's configure the Jenkins

Hit the URL in the http://localhost:8080 this is the default port on which Jenkins runs you can change that. It will ask you the first time login secret key.

Initial password 
Next is select the defaults option to configure the Jenkins

Default feature
You can always install other plugins as well from the Manage Jenkins section

Once everything is configured you will see this screen

Jenkins is ready!!

Next is create a job that will start/stop/restart the SDL microservice

Click on create new job

I have created the following three jobs to stop/start and restart Tridion microservice using  Powershell commands we can sh commands in case of LINUX.

Tridion Services

Console output of Restart Deployer Service

Output

For monitoring the health and traffic on the machine we can use Jenkins Monitoring feature.
Go to:- http://localhost:8080/monitoring


Here you will get the necessary information related to the system health using Jenkins,  you can always use any other tool to do this.

Happy Coding and Keep Sharing!!!


Monday 1 July 2019

Extending Storage Type in SDL Tridion DOCS 2013 SP2

Recently, I got the opportunity to explore and work on SDL Tridion Docs 2013 SP2 where I need to develop an extension. The client is using their own ElasticSearch instance and wants us to continue using the same instance to index DOCS data in it.

To start with I first explored the SDL DOCS documentation to understand if at all storage extension is supported or not and yes Extension is available not just storage but you can extend the Deployer as well :). "Maybe in the next blog".

After, spending some time on Documentation I was clear what I need to do in order to extend the storage type.

For the initial steps "How to set up the JAVA project and generate custom.JAR" you can follow my previous blogs. In SDL Tridion DOCS, we have the following Content Delivery roles and with that data is published into UDP (Unified Delivery Platform).

  • Discovery Service
  • Content Service
  • Context Service
  • IQ Service for Indexing and Querying data In/From Elastic
  • Contextual Image Delivery
  • UGC Service
Coming back, to Extending the Storage we need to configure the Deployer, here we need to deploy custom jar, customDAO.xml and configure the cd_storage file, similar to what we do when extending the storage with Tridion WEB/SITES.

Below is the output captured in the log file in the JSON format after we deployed the custom jar file that contains code to extend and published the item from SDL Tridion DOCS 2013 SP2.


JSON in deployer logs

JSON of Dummy content

In the next blog, we will see what else we can do with this and how much flexible the extension point of storage is, Until then.

Happy Coding and Keep Sharing!!!