This is in continuation of my
previous post where we build Alchemy plugin to download and search CMS items.I have further enhanced that one and added new feature as CMS level dashboard where we have multiple data points options and multiple chart options to represent the data in pictorial form.
Let's see the new addition in this Plugin DASHBOARD.
Dashboards often provide at-a-glance views.A data dashboard is an information management tool that visually tracks, analyzes and displays key performance using pictorial representation of the data , with the help of this dashboard we can identity the usage of different CMS items based on date using charts.
Here,We have 3 filters.
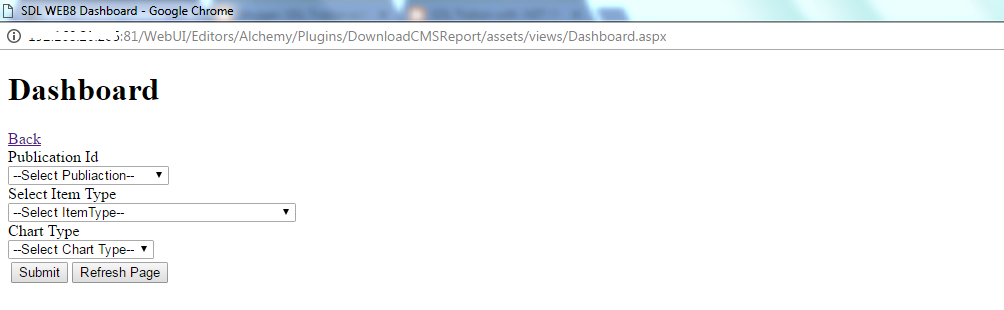
 |
| Dashboard |
Let's run this and see how its looks like with all the charts and information which represent .Let's generate charts based on All the components created month wise using all three charts.
1.Bar and Column Chart.
 |
| Bar and Column chart |
2.All three charts representing the number of content created month wise in pictorial form we can have same information available year wise as well.
 |
| All three charts. |
3.Similar to components right we can generate information for pages for month and year wise.
4. Schema utilization number of components created using any particular schema
 |
| Schema utilization |
With the help of all these information when can do CMS DB forecasting, CMS clean-up activity,Content growth.I have used Core Service,JQuery and Google visualization API to create dashboard.
Let's see the enhancement in the existing report Plugin.
- Download button to export the search data in .csv format.
- <a> link to open any item in the CMS to verify or cross check.
- You can open any Item in same or new window.
- Improved UI
- JQuery searching to filter data
 |
| Anchor tag with UI improvement |
 |
| Download and Data searching . |
Happy coding and keep sharing !!!!


No comments:
Post a Comment